Documenting Amphibian Road Crossings
A historical data analysis of spring amphibian patrol records, using R to organize field observations and examine species composition, recorded condition, and variation among road transects.
Turning patrol records into ecological information
Seasonal amphibian movements can bring salamanders, frogs, and toads across roads as they move between terrestrial habitat and breeding areas. Volunteer patrols document these crossings and record whether animals are found alive or dead. This project revisits historical patrol records to make the information easier to inspect, summarize, and use in future conservation work.
The analysis focuses on two distinct historical sources: an individual encounter log from Thomas Road in spring 2008 and a 2011 crossing workbook organized by transect and time interval. I cleaned the records into analysis-ready tables and used R to summarize species counts and recorded condition. The two years are presented separately because the collection formats and sampling structures differ.
Research question & objectives
What do historical amphibian patrol records reveal about the species documented during spring road crossings, their recorded condition, and differences among surveyed transects?
01 · Organize
Convert legacy spreadsheets into tidy observation and count tables while preserving original labels and uncertain entries.
02 · Describe
Summarize species composition and recorded alive/dead condition within each source year.
03 · Compare carefully
Explore differences among 2011 transects and time intervals without assuming equal survey effort.
04 · Prepare for GIS
Identify which missing spatial and survey fields would be needed for future crossing-hotspot analysis.
Datasets and structure
| Source | Organization | What it can support |
|---|---|---|
| Thomas Road · Spring 2008 | Individual encounter rows with date, observers, time, species label, condition code, and location notes. | Species composition, recorded condition, and date-level summaries. |
| Amphibian Crossing · April 4, 2011 | Transect sheets and time-interval counts, including alive/dead tallies by species. | Species totals, recorded condition, and descriptive transect comparisons. |
| 2025 TCAMP patrol datasheet | Blank field form with route, weather, start/end time and temperature, traffic tally, species tallies, movement direction, notes, and fields for coordinates of major crossings or sick individuals. | Documents the intended contemporary collection fields; it is not a completed observation dataset. |
Cleaning and analysis workflow
Inspect the source workbooks
Review sheet layouts, headers, species rows, transect names, date/time fields, and ambiguous entries before combining data.
Reshape into tidy records
Store 2008 as one row per individual encounter. Store 2011 as one row per species, status, transect, and time interval with a count field.
Preserve uncertainty
Keep unknown or unspecified identifications visible rather than forcing them into a known species. Retain notes about ambiguous counts.
Summarize in R
Calculate species totals, alive/dead tallies, and transect summaries, then create reproducible high-resolution charts.
Audit totals against source summaries
Compare the tidy record sums with the printed workbook totals and document differences rather than silently adjusting values.
What the records show
2008 · Thomas Road encounter log
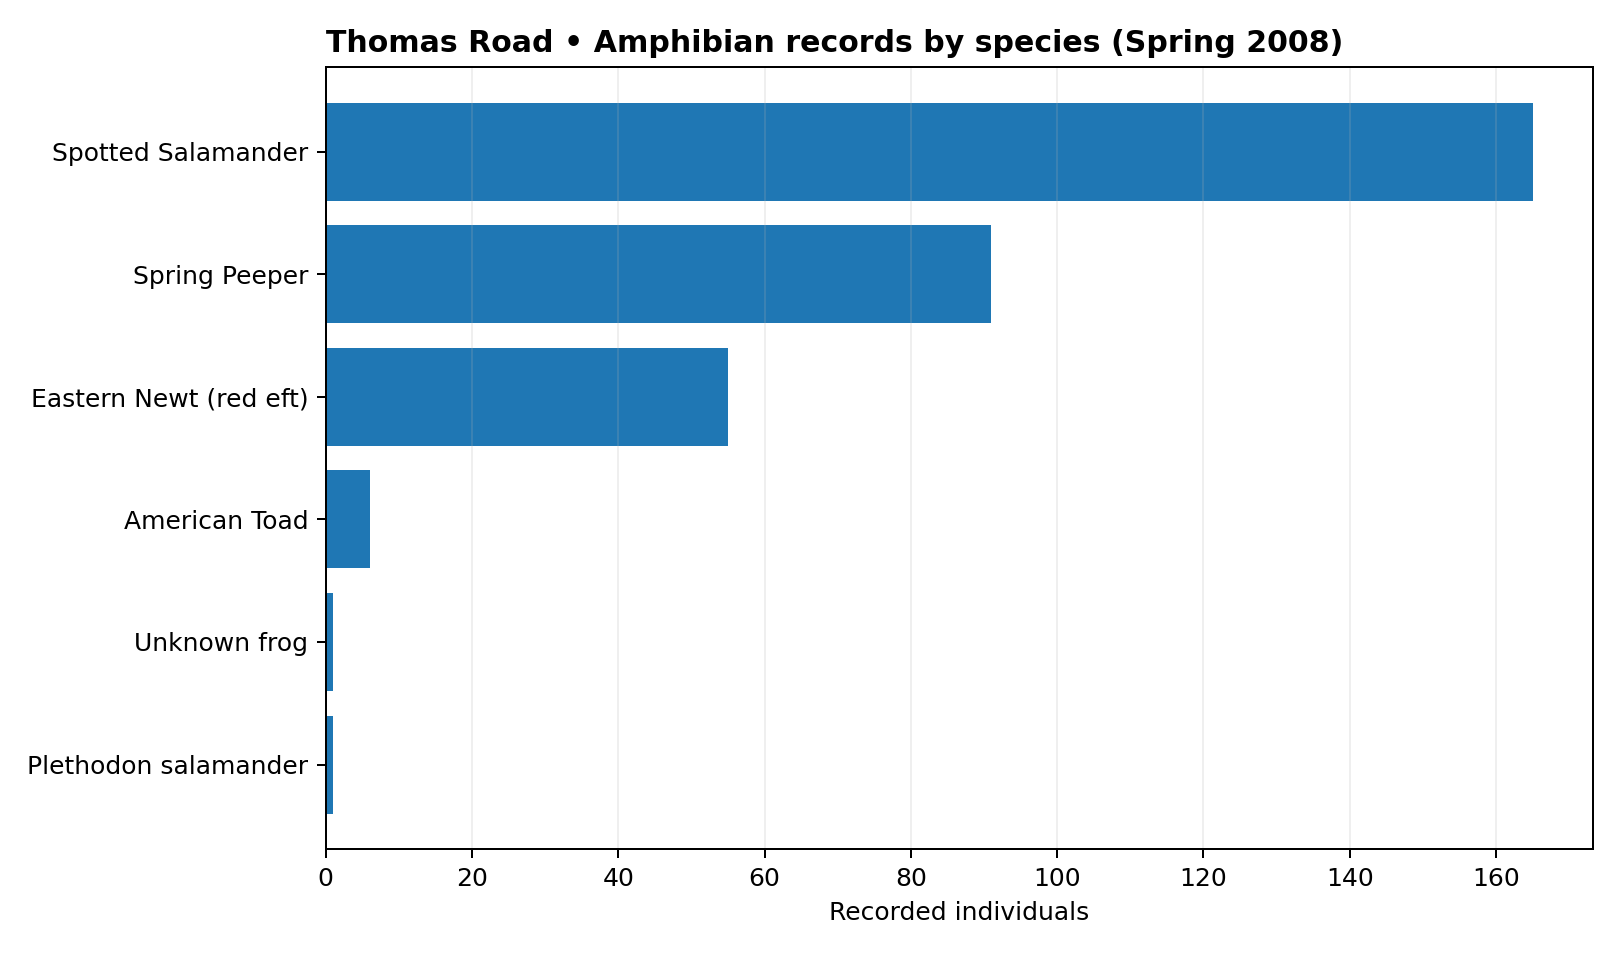
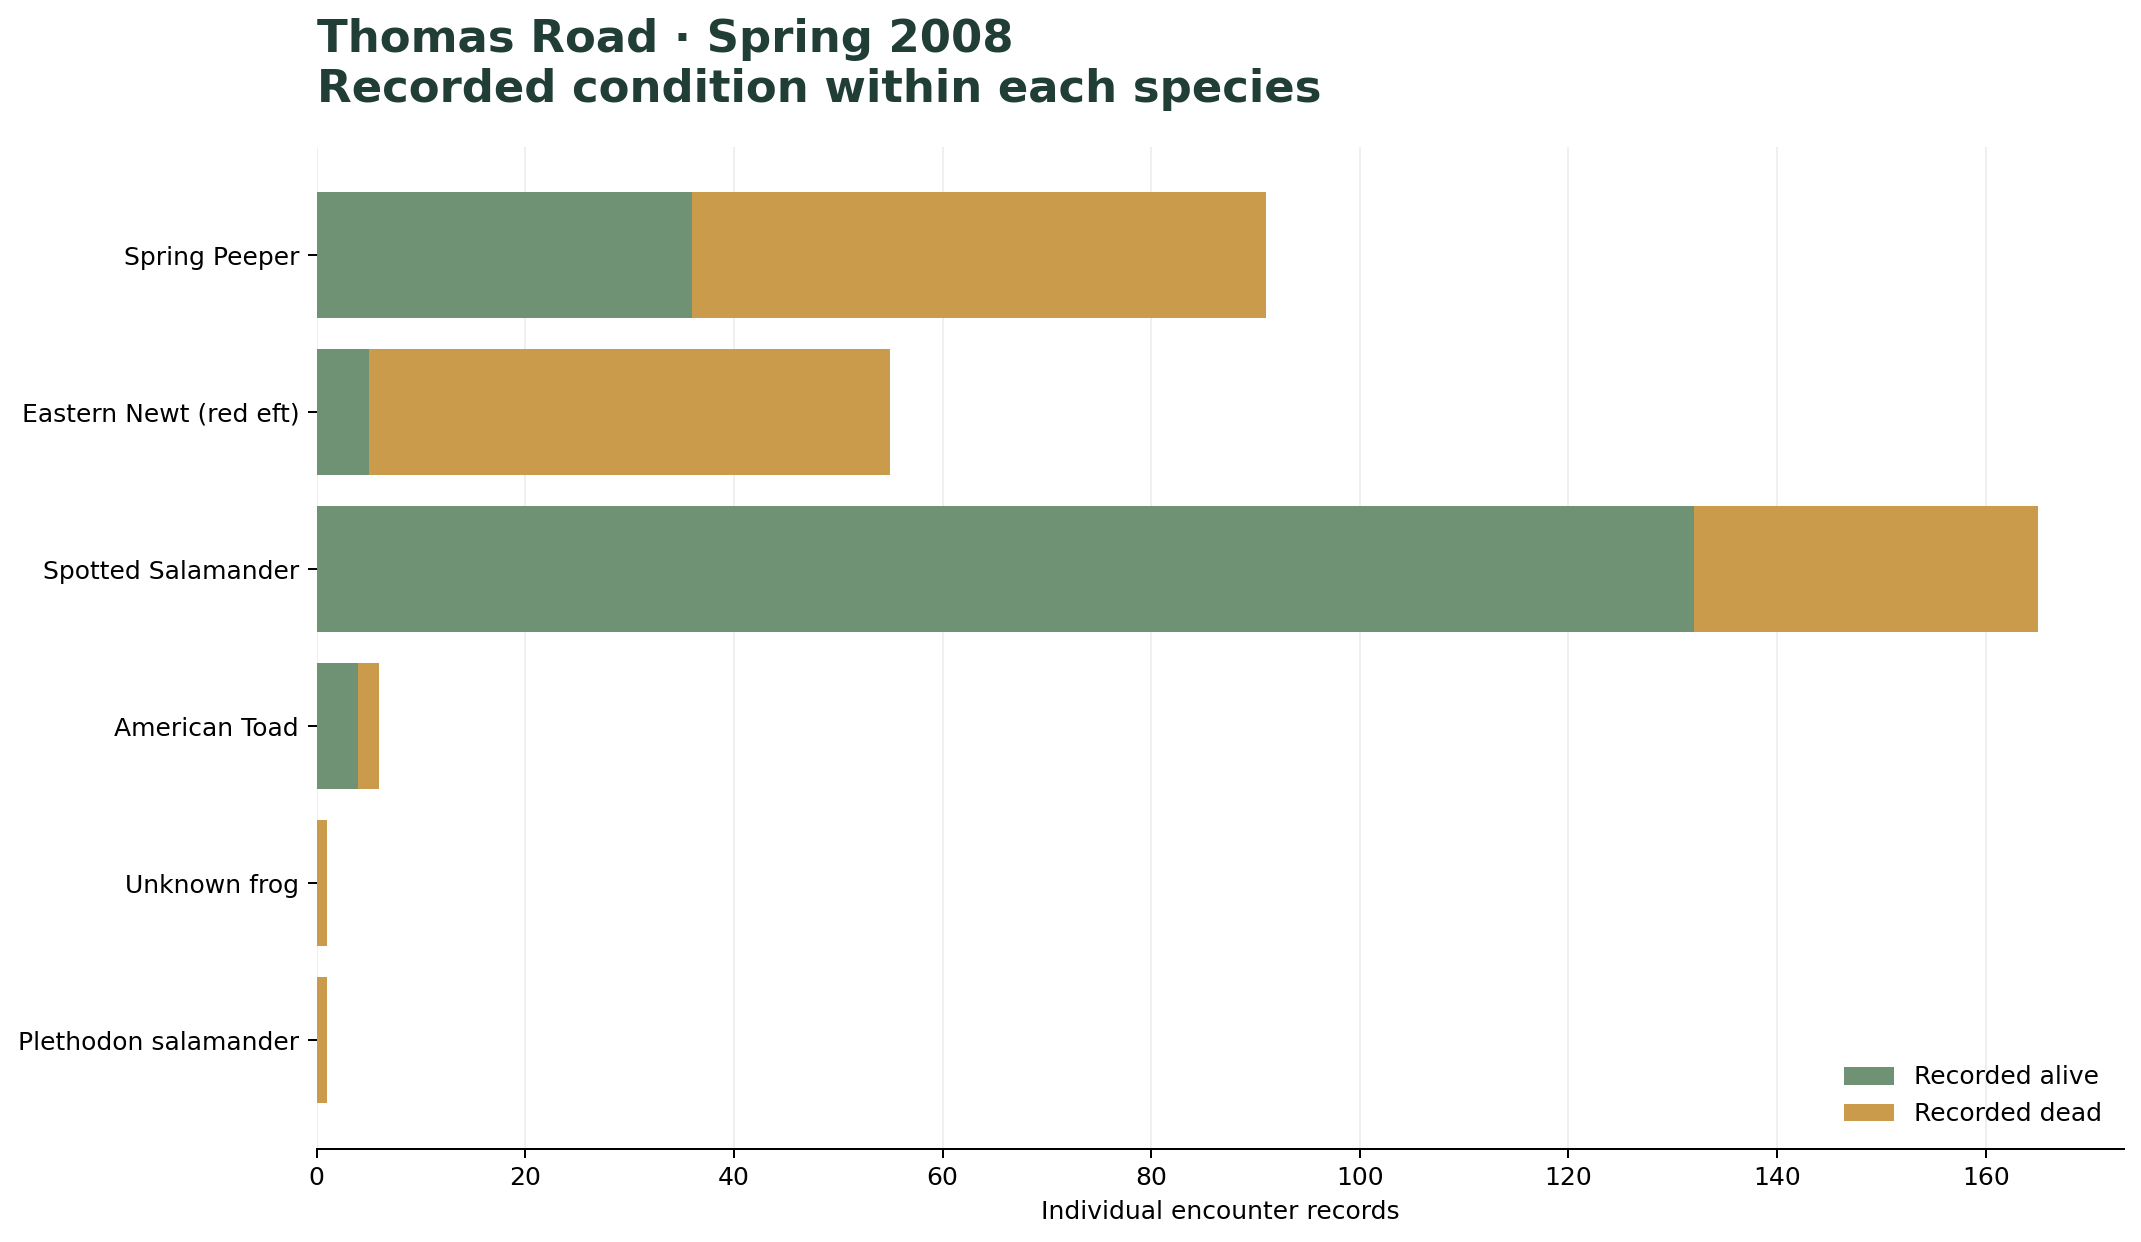
The 319 encounter records span three dates: March 31 (126 records), April 4 (104), and April 11 (89). Spotted Salamander is the largest recorded group with 165 encounters (51.7%), followed by Spring Peeper with 91 (28.5%) and Eastern Newt (red eft) with 55 (17.2%). The remaining six records are distributed across American Toad (6), Plethodon salamander (1), and Unknown frog (1).
The alive/dead split is a description of this encounter log, not a mortality rate for the road or a population-level survival estimate. The records are individual entries, and the source does not provide a denominator for all animals that attempted to cross.
2011 · April 4 transect workbook
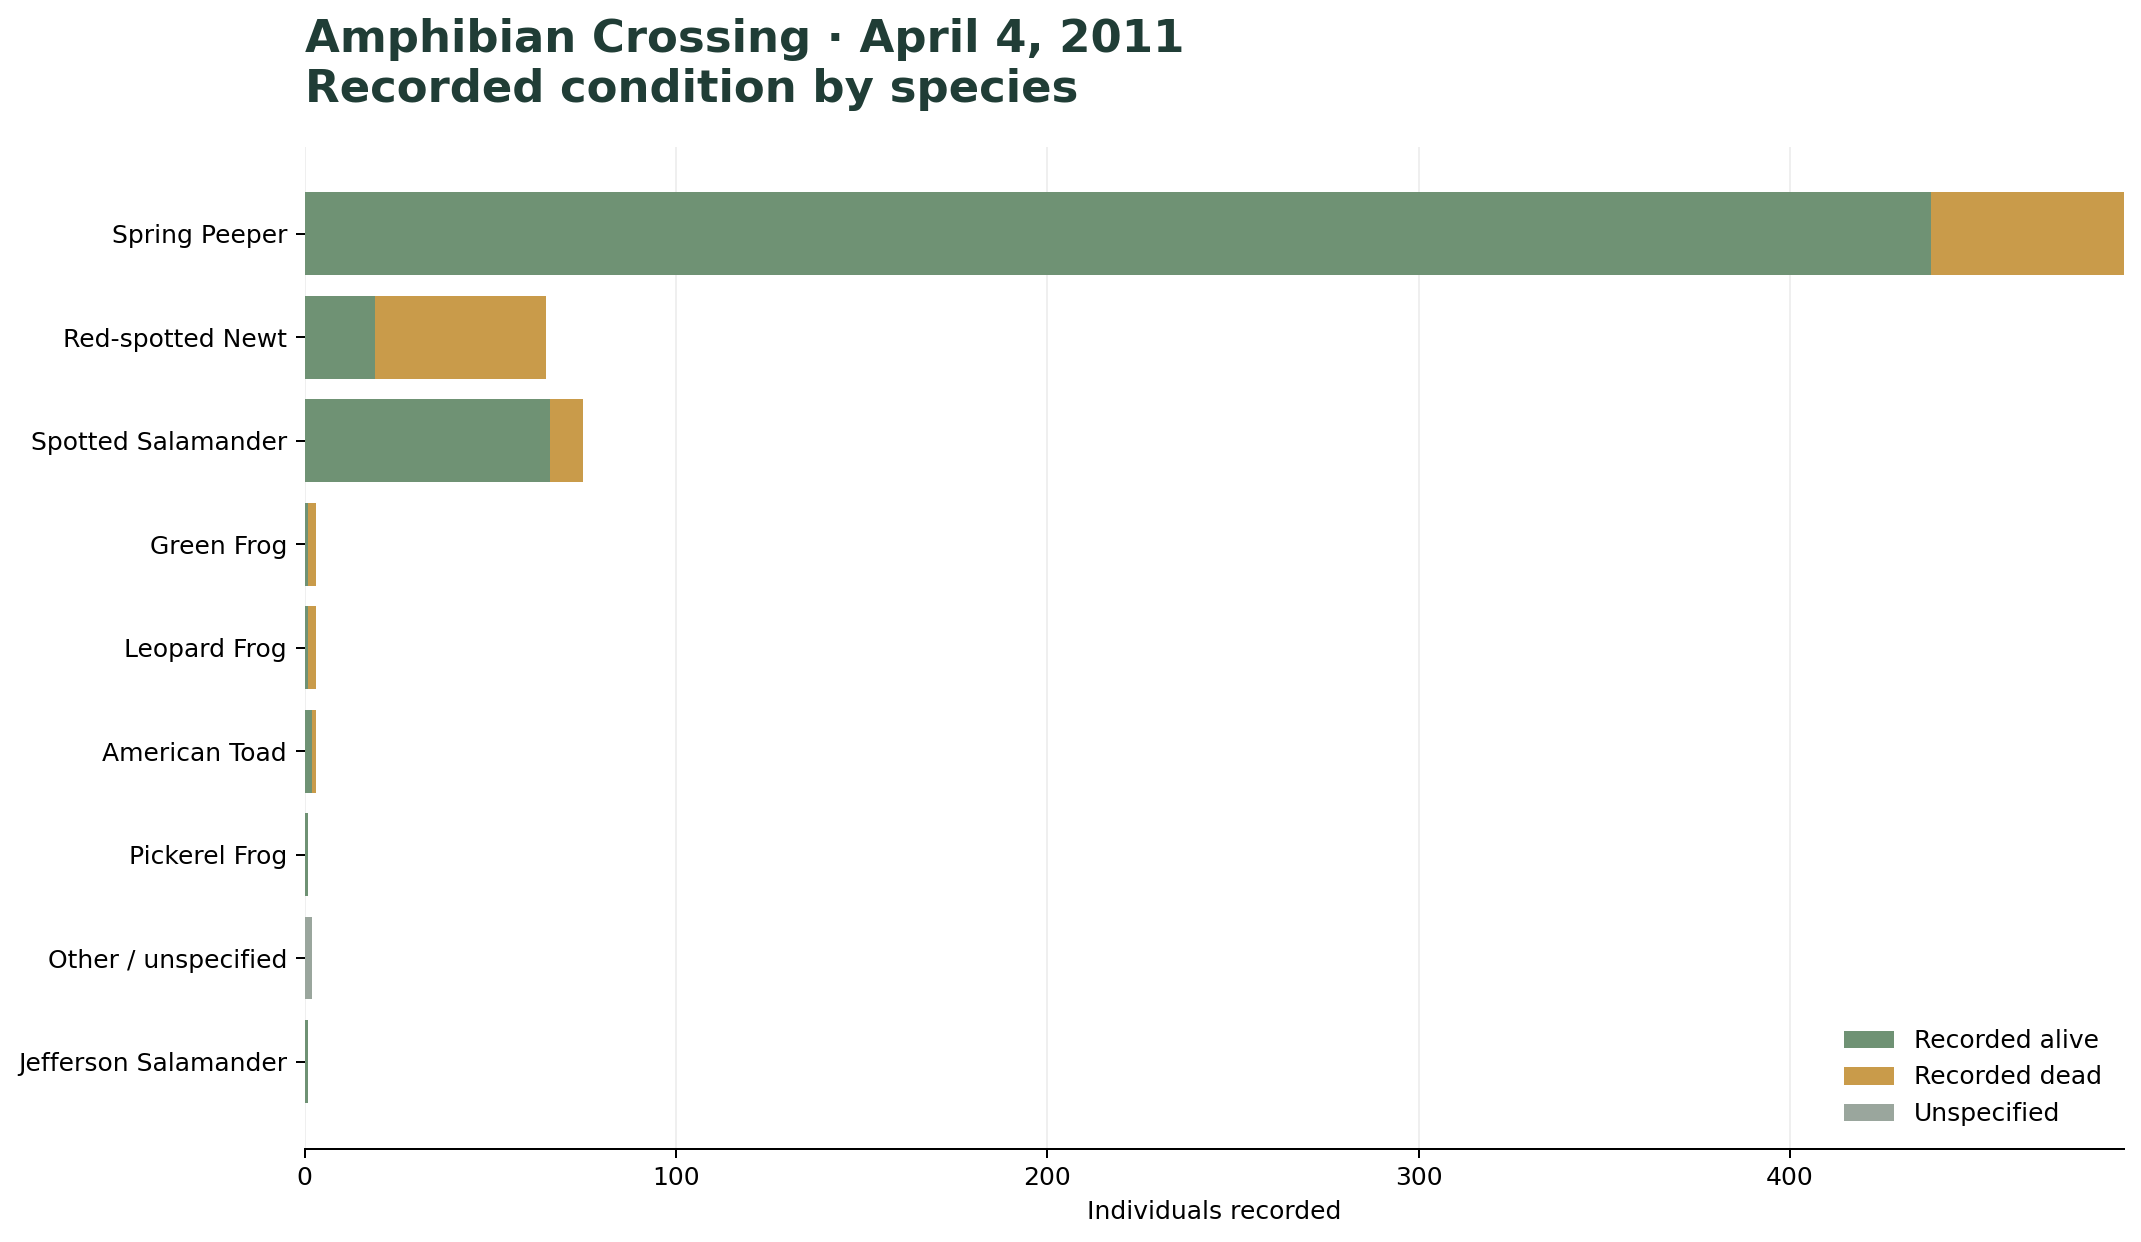
The workbook summary reports 643 individuals: 532 alive and 111 dead. The cleaned species/status rows also sum to 643, but classify 529 as alive, 112 as dead, and 2 as unknown/unspecified. The two records coded as unknown/unspecified are shown separately in the cleaned table; this explains why the status subtotals differ from the workbook's printed alive/dead summary.
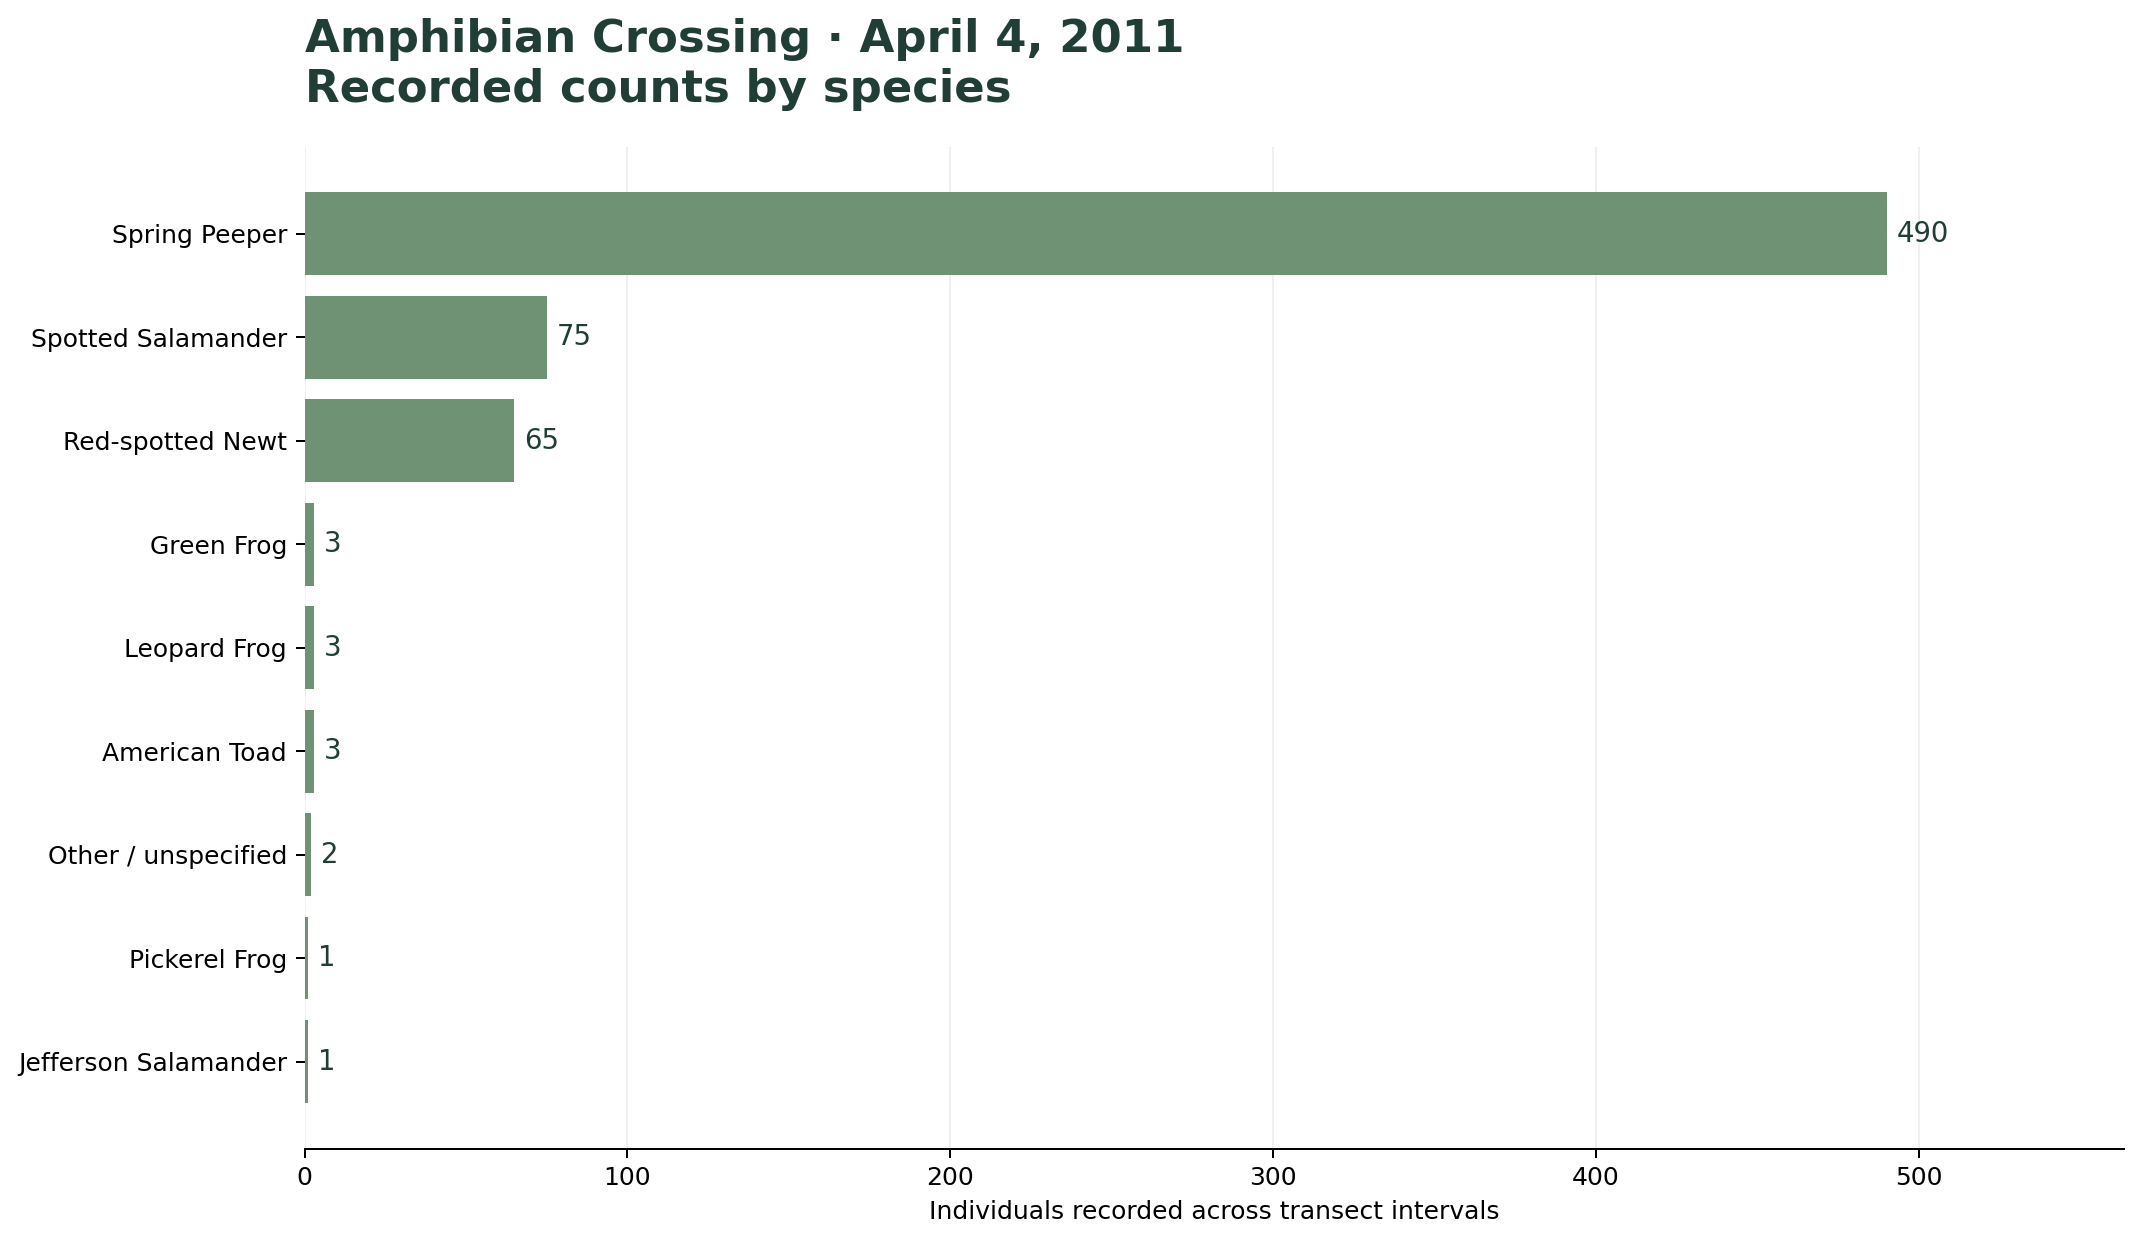
Spring Peeper dominates the species-level tally with 490 individuals (76.2% of the cleaned 643 total), followed by Spotted Salamander (75; 11.7%) and Red-spotted Newt (65; 10.1%). All remaining named and unspecified categories account for 13 individuals combined.
2011 · Differences among transects
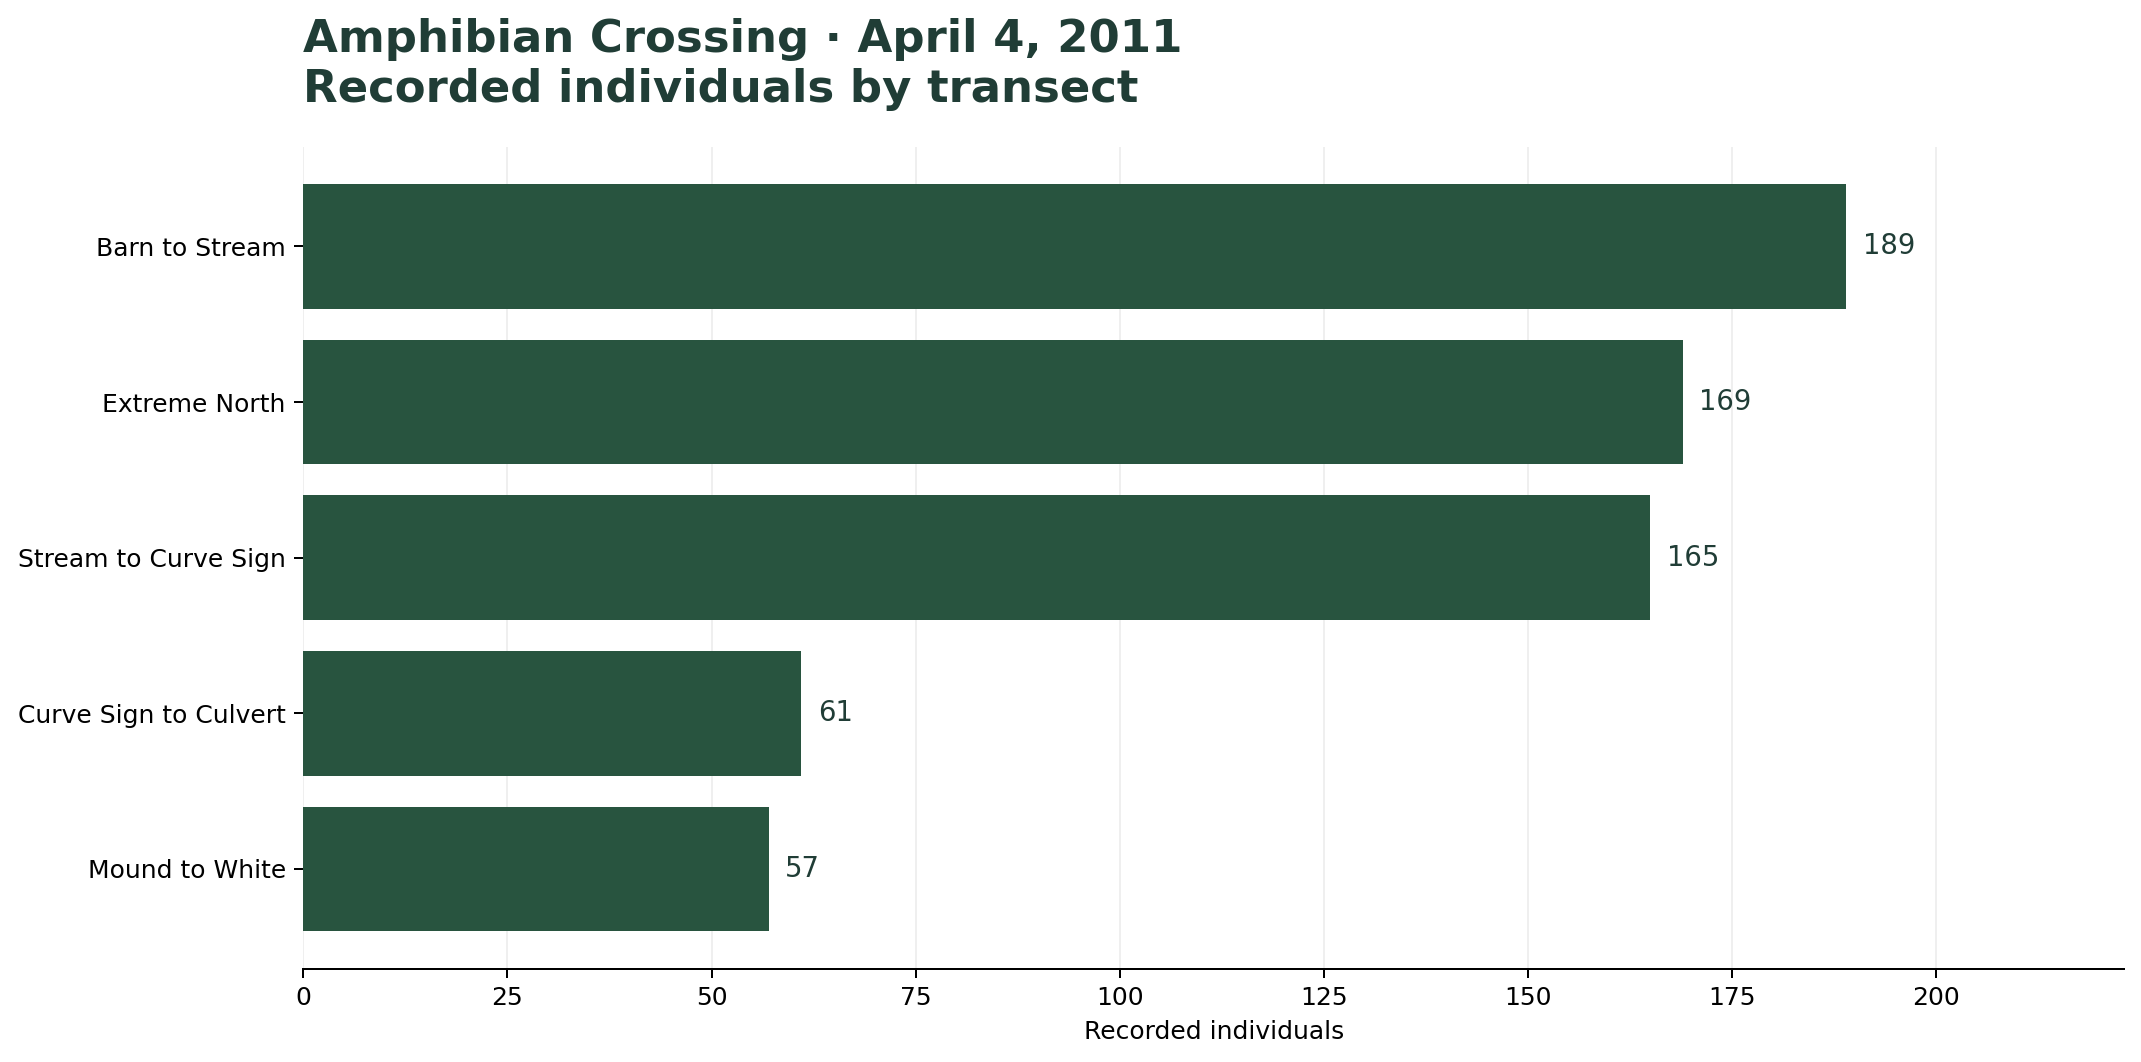
The workbook's summary lists 189 individuals for Barn to Stream, 165 for Stream to Curve Sign, 61 for Curve Sign to Culvert, 57 for Mound to White, and 171 for Extreme North. The cleaned detailed rows contain 169 records assigned to Extreme North plus 2 records marked Other / unspecified at the all-transects level. The workbook's summary total is 643. These values are retained as reported rather than assigning the two unallocated records to a specific transect.
Figures & exploratory summaries
These figures are deliberately larger so labels, counts, and differences can be read comfortably on a portfolio page. Each figure uses the same forest-green and muted-sage palette as the related biodiversity research page.
Data limitations & interpretation
Different recording units
The 2008 file contains individual encounter rows, while 2011 uses grouped counts by species, status, transect, and interval. Raw totals should not be compared as if they came from identical sampling protocols.
Uneven survey effort
The supplied records do not consistently provide route length, patrol duration, weather, traffic, or observer effort in a form that supports standardized rates across all records.
Uncertain and unspecified entries
Some species labels and counts are ambiguous. Unknown or unspecified records remain visible and are not silently assigned to a taxon or transect.
Limited geographic information
The historical spreadsheets supplied for this analysis do not contain consistent coordinates suitable for mapping individual crossings or producing a defensible hotspot map.
From historical records to spatial conservation tools
- Standardize future patrol data: use consistent species names, explicit zero versus missing values, route identifiers, start/end times, weather, and observer fields.
- Collect georeferenced crossings: record coordinates for individual observations or at least for crossing clusters, with a clear method for recording location accuracy.
- Calculate comparable rates: where effort data are available, examine observations per mile or per patrol-hour rather than comparing raw totals alone.
- Build a GIS database: connect patrol observations to road segments, wetlands, streams, land cover, and potential crossing structures.
- Identify priority locations: once repeated georeferenced surveys exist, examine spatial clusters and candidate sites for mitigation.
The longer-term goal is a repeatable conservation data workflow that connects volunteer field observations with R, GIS, and clear public-facing visualizations.